


Unbiased telemetry across forty regions.
We run simulated workloads on bare-metal instances hourly. Query real-time packet-level latency, CPU constraints, and network throughput without affiliate bias.
Telemetry parsed by stack layer
Filter raw performance data by CPU, memory, disk I/O, and network throughput to match your specific infrastructure footprint.
Compute Profiles
I/O Throughput
Network Latency
Isolate bare-metal performance. Filter raw telemetry by core count, clock speed, and memory bus saturation during simulated workloads.
Measure disk read-write speeds and NVMe latency under heavy transactional stress. Track real-world storage degradation across hundreds of active nodes.
Track packet-level latency and packet drops across forty regions in real-time. Analyze routing efficiency across multiple global transit networks.

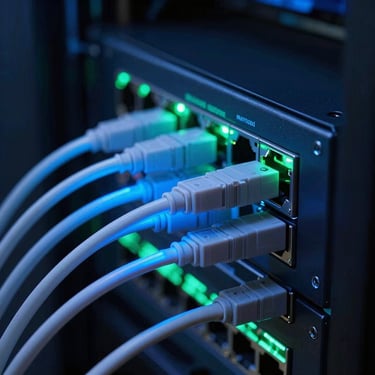

Visualizing live routing paths
Raw screenshots from our active simulation dashboards, capturing real-time packet-level latency spikes and bare-metal performance metrics across global networks.
Query the raw telemetry
Get immediate access to CSV exports of our hourly workload simulations. No affiliate links, no sponsored rankings.